Home
Deals
Explore
Dashboard
Ai Assistant
Bookmarks
Sign out
Signin
About 1 results for "UCUBDBzmd_cdXNigezV-dhow"
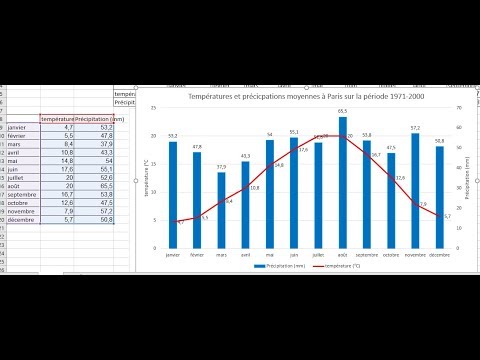
Créer un graphique avec histogramme et courbe et 2 axes différents (ex : données météorologiques)
Laurent L • May 9, 2019
Home
AiChat
Shop
Saved
Account
AI Assistant
Loading...
Show More
No messages yet. Start a conversation!
Loading...
content will be injected here