About 39 results for "UCGuktEl5InrcxPfCjmPWxsA"
Featured Results


PT1H31M
Using ggplot2 to demonstrate the regressive nature of Trump's spending bill (CC364)
Riffomonas ProjectJul 31, 2025
PT54M8S
Plotting a regression line on a scatter plot of smoking and drinking data with ggplot2 (CC355)
Riffomonas ProjectApr 17, 2025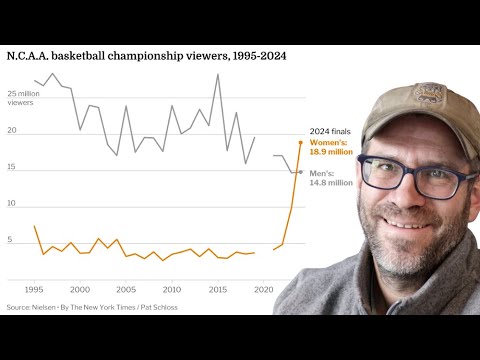
PT51M12S
Scraping the web with R to create NY Times plot of March Madness Championship viewership (CC354)
Riffomonas ProjectApr 3, 2025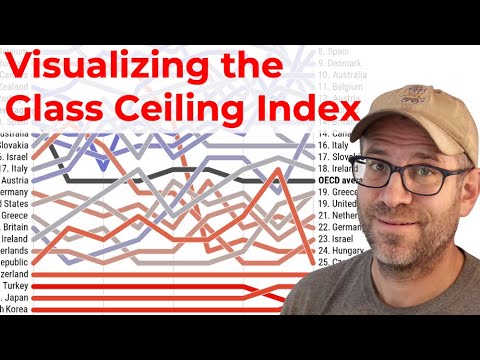
PT50M40S
Visualizing the The Economist's Glass Ceiling Index in R with ggplot2 and ggborderline (CC353)
Riffomonas ProjectMar 28, 2025
PT32M21S
Replacing a stacked bar plot with a dot plot in R with ggplot2 (CC352)
Riffomonas ProjectMar 24, 2025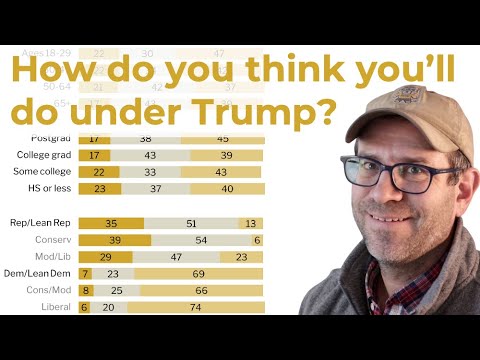
PT39M47S
Recreating a stacked barplot from the Pew Research Center in R with ggplot2 (CC350)
Riffomonas ProjectMar 17, 2025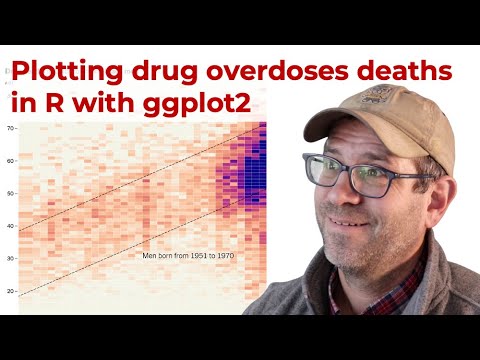
PT39M21S
Recreating a NYT heatmap of deaths by drug overdoses in R with ggplot2 (CC349)
Riffomonas ProjectMar 13, 2025
PT59M28S
How to extract data from a heatmap with R using the tidyverse (CC348)
Riffomonas ProjectMar 11, 2025
PT45M35S
How to recreate a historic map in R using the sf and ggplot2 packages (CC347)
Riffomonas ProjectMar 6, 2025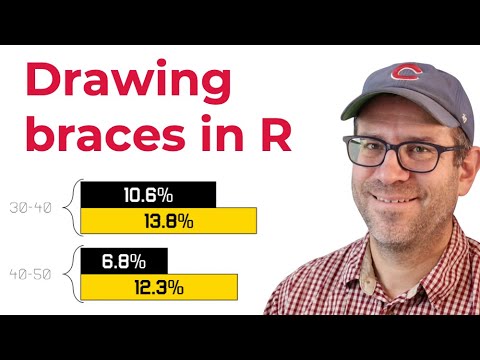
PT51M17S
How to draw braces to annotate a bar plot in R using ggplot2 (CC346)
Riffomonas ProjectMar 3, 2025
PT56M28S
How to recreate DuBois's spiral plot from the 1900 Paris Exposition using R and ggplot2 (CC344)
Riffomonas ProjectFeb 24, 2025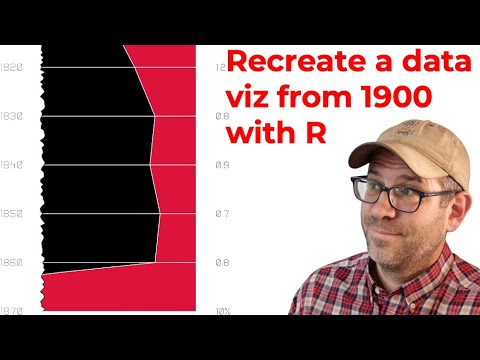
PT52M15S
How to recreate WEB DuBois's Panel 12 from the 1900 Paris Exposition using R and ggplot2 (CC340)
Riffomonas ProjectFeb 10, 2025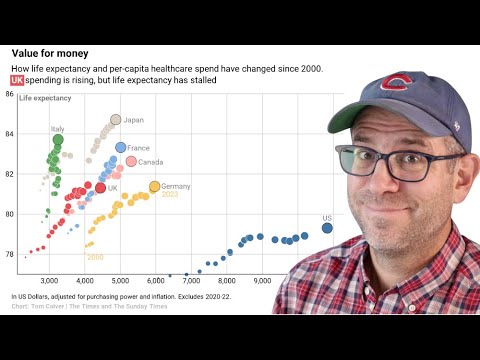
PT54M44S
Using ggplot2 to visualize relationship between life expectancy and health spending in R (CC338)
Riffomonas ProjectFeb 3, 2025
PT42M40S
Recreating a side-by-side line plot from CNN using patchwork and ggplot2 in R (CC331)
Riffomonas ProjectJan 9, 2025
PT34M30S
Using lintr and styler to improve the quality and readability of R code (CC300)
Riffomonas ProjectAug 26, 2024

PT28M35S
Using factors in R to create a new calendar and see how much snow do we get in Michigan (CC238)
Riffomonas ProjectAug 11, 2022
PT22M50S
Fitting and visualizing linear regression models with the ggplot2 R package (CC237)
Riffomonas ProjectAug 8, 2022


PT23M9S